It has been a long time since I have posted anything here, but I feel like sharing a bit of what we have been up to. We have been working on improving the quality of our tests, and increasing what we can measure while reducing the amount of data that we need to transfer to do the measurements. Part of this work has been developing a custom web server written in Go that uses a highly efficient packet capture mechanism (golibpcap). All this is wrapped up in something we call the net-score diagnostic test server (nsdt-server).
Without the nsdt-server we are limited to only looking at timings exposed at the application level (HTTP) as this is all the browser gives us. This data is great for looking at end-to-end performance that applications can expect, because it is performance at the application. It encompases everything between the server and the client giving a complete measurement - how long did an object take to get from server to client. Simple and useful. But what it does not tell us is why?
A lot can happen in the 30 ms between when the server sends the data and when it actually is received by the client. The browser tells us that an object has finished downloading only after it has arrived in full - every last bit. Before that last bit arrives there could have been packets that were lost, sent out of order, malformed and retransmitted. This can mean that instead of one round trip to the server to get our object we may have had to make many smaller requests to make up for mishaps along the way. Lucky for us TCP takes care of all the messy work but knowing what lengths TCP had to go through to get a complete copy of the data can tell us a lot about possible inefficiencies in the connection.
To learn about how TCP works hard so that applications don't have to you can use tools that capture streams of packets like wireshark. This is great if you want to see one connection (your own), but we needed something that was going to scale to global proportions.
Part of our nsdt-server is a RESTful interface for starting packet traces. Without going into too much detail here our server can manage many traces at once and when a trace completes it sends the results to a central control server to be processed. Even with a highly efficient server we are going to need hundreds of these spread all over the world so we also developed a decentralized load balancer to send clients to a server that has a light load. This decentralized load balancing server also keeps track of what servers are online and allows new servers to join without any human interaction.
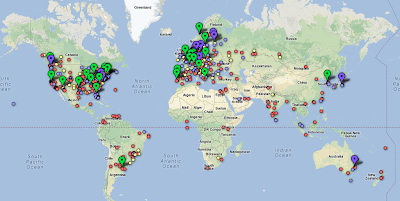
I keep using the word global because even in our very quiet beginning we have data coming in from six continents! Which is great because we are trying to build a globally representative picture of broadband access, but we still need more data. Here is an interactive sample of some of the data we have collected so far. You can see that western Europe and the eastern United States have the best coverage, but with more reach we hope to illuminate some of the darker corners of the global broadband market (like our tests from Fiji and Bermuda). Here is a bigger interactive view of the map below.
The hope at this point is that you are interested in getting involved. If you have a blog or website no matter how small or obscure (actually the more obscure the better) you can help by putting a small snippet of our code in your website/blog. We have widgets that can be installed into Google sites and Blogger, and JavaScript that can be pasted into other sites. We would love for you to install a visible version of the tool (like in the top right corner of this page), but if you want something low-key we have a version that runs completely in the background too. Detailed instructions can be found here, and if they are not clear or you need help we are glad to help.
Cross posted on my personal blog.
